CLICK HERE FOR BLOGGER TEMPLATES AND MYSPACE LAYOUTS »

Saturday, April 25, 2009

SPSS.....

Today, we are going to talk about the research that we have done in the previous class. We were asked to present what we have done for our research. Then, we are introduced to SPSS in the IT class. We were asked to give code to the demography of the respondent. For example, for the sex of the respondent, 1 represent male and 2 represent female. For the academic background, 1 represent nursing student Diploma 2nd year and 2 represent nursing student Degree 2nd year and 3 represent nursing student Degree 3rd year.

Then we were asked to open the SPSS in the computer. We were asked to explore the SPSS by reading on some of the example in the computer which has key in the data in the SPSS. In the SPSS, there are 2 types of view which are “data view” and “variable view”. To start to use the SPSS, we should start from the ‘variable view”. There are 10 column in the “variable view” which consist of ‘name’, ‘type’, ‘width’, ‘decimals’, ‘label’, ‘values’, ‘missing’, ‘columns’, ‘align’, and ‘measure’. To key each of the research data that you have colleted, you will need to fill in all the details in the variable view before you key in the data. First, you will need to name the question, then select “numeric’ for the variable type” and at the same time I change the decimals into zero before for the data that I collect do not need decimal. Then in the label column, I fill in more details about each of the data question. The values column is the answer of my question in the research which is represent by code also at the same time. In the measure column, there are 3 types of measures that you can choose which are ‘scale’, ‘nominal’ and ‘ordinal’.

Nominal Data

A set of data is said to be nominal if the values / observations belonging to it can be assigned a code in the form of a number where the numbers are simply labels. You can count but not order or measure nominal data. For example, in a data set males could be coded as 0, females as 1; marital status of an individual could be coded as Y if married, N if single.

Ordinal Data

A set of data is said to be ordinal if the values / observations belonging to it can be ranked (put in order) or have a rating scale attached. You can count and order, but not measure, ordinal data. The categories for an ordinal set of data have a natural order, for example, suppose a group of people were asked to taste varieties of biscuit and classify each biscuit on a rating scale of 1 to 5, representing strongly dislike, dislike, neutral, like, strongly like. A rating of 5 indicates more enjoyment than a rating of 4, for example, so such data are ordinal. However, the distinction between neighbouring points on the scale is not necessarily always the same. For instance, the difference in enjoyment expressed by giving a rating of 2 rather than 1 might be much less than the difference in enjoyment expressed by giving a rating of 4 rather than 3.
Then after setting all the variable view, You can start to key in the data that you collected from the respondent. because the research is a group work so we divede the questionnare into 3 and each of us key in data from 20 questionnare. After 3 of us has key in, we combine the 3 files into one. How? first, open the first part of the file in spss, then, go to select 'Data' at the left above corner of the page, select 'Merge Files', then Select 'Add Cases' and a window will pop out and lastly click ok on the window. Then the files is combined. But, must make sure that the variable view you set must exactly the same with your friends so that you can combined it.
After combined all the file in one single file, you can create a summary by using the SPSS software. You can also calculate the data that you have key in by using the software. You do not need to calculate it manually. For example, you can click on 'analyze' on the left corner of the page in the spss, then, click on 'Descriptive Statistics". There are 5 choices that you can choose on to analyze your data such as ' Frequencies', 'Descriptives', 'Explore', 'Crosstabs' and ' Ratio'. You need to choose the suitable and appropriate types to analyze your data. For example, due to my data mostly is nominal type, so i can't choose 'Descriptives' to analyze my data. Ordinal types data is more suitable to choose on 'Descriptives'.
You can also click on 'Graphs' on the above of the page of spss. Then, you can graph bar , line or pie to analyze your data which you think is suitable for the data. All the graphs and table of frequencies will appear in SPSS viewer which you can save the viewer in '.spo' format or you can copy the graphs or table from the spss viewer to the Microsoft Word. After finish using the data in spss, you can save the data in '.sav' in order to let you open again in the next session.

Tuesday, April 7, 2009

Microsoft Excel......

Topic for today IT class is Microsoft Excel. Microsoft Excel is so useful in doing an account. So, today we are going to learn how to create a simple account for our expenses for one year by using Microsoft Excel.

First of all, open the Microsoft excel in your computer. there are many small box in the page and the small is called cell. Each cell has it own name such as B1, G6, C7 and so on. Then, when you click on one cell, there is a bold box around the cell. If you want to continue numbering from the first cell until the 20th cell, for example, you just need to key in for 1 and 2 in the first and second cell then highlight the whole column by dragging your mouse at the corner of the cell to the last cell which you wish to numbering. Then the highlight cell will numbering automatically without typing it manually.

By open one Microsoft excel, you can create few sheet of paper. You can also name the each sheet of the file by right click on the word "sheet" below and click on rename. After you key in all the data for your account about your daily expenses, you can use the function of autosum by clicking on the cell which you wish to put the sum and click the icon of autosum and then highlight the cells that contain the data that you wish to sum up and click enter. Besides sum up each row, you can also sum up all by dragging your mouse to all column.

Besides, you can also insert comment to each cell by right-clicking the cell and click on insert comment then just type in your comment. Then, you can also insert formula to calculate the balance or total of your data that you want. By using the formula, you can do several type of calculation by creating your own formula.

To make your account more clear and easy to interpret, you can add in border to your account by clicking the icon 'border" on the top of the page. Then, to make your account more interesting, you can add in color to your account.

You can also insert graph in your account to see the trend of your expenses. First you highlight the subject that you wish to show in your graph then click on 'ctrl' panel on the keyboard and at the same time highlight the data of each subject. Then, click on the icon 'chart wizard'. Choose your preferred chart and click 'next'. It will show your chart and your click 'next' once again. You can key in your chart title, title for y-axis and x-axis then click 'next' again. Lastly, if you want your chart in the same sheet, just choose on the setting and click 'finish' to complete your chart. It will appear on your page of your account.

After your finish one month account and want to continue the next month you can create in the new sheet. If your don't want to recreate all the things, you can right click on the 'sheet 1' below left page and click on 'move or copy' then decide which sheet you want to move then tick on the box of 'create a copy' then click 'ok'. All the things will appear on the new sheet. You can change the date and all the data. If you want to move your balance from the previous month to the present month, you can click on the cell that you wish to key in and set in a new formula. For the formula, key in = , then click the previous month sheet, then click on the balance and click enter. Then, the balance will move from previous to present month.

Monday, April 6, 2009

Ways to create a Power Point Presentation...


By using Microsoft Power Point, you can create an attractive and effective presentation.

After you collect all the data that you need in the presentation, you can start to create your presentation using Microsoft Power Point. First, you can choose your slide layout. there are several slide layout. Then, you can click on the icon "AutoShapes". In the autoshapes, you can choose lines, connectors, basic shapes, block arrows, flow chart, stars and banners and many more things that you can insert in your slide show. If you choose to draw a love-shaped in you slide, you can also make your love-shaped from 2D into 3D which look more attractive.

Then, you can color your love-shaped by right click on the love-shaped then choose "format autoshapes..". It pop up a window "Format Autoshape". From there, you can fill in with different color or even fill picture in your love-shaped. After that, you can insert your text in your love-shaped box.

If you are doing a mind map in your slide which contain various text box, you can connect your text box with the connectors which you can find in the "autoshape". The connectors will always connect your text box together wherever you move your text box. Then, in order to make your presentation more interesting, you can design the animation of your slide. You can click on "Custom Animation". Then, you choose on the item that you plan to put on animation. After clicking or highlighting the item, you can modify your animation of your slide. You can decide which text box or picture should come out first and last.

Then, there is a ways to help you create your presentation more easily which are using slide master. First, you click on "View", then click on "Master", then select "slide master". Once you click on this, what you need to do is to edit the master slide. The things that you edit on the master slide will appear on every slide. For example, if you have select a picture to become the background of all the slides, you just need to add the picture in the master slide then it will automatically appear in all slides. You can also edit header and footer in the master slide. For example, if you want to insert date in all your slides at the corner, you just need to go to your master slide and add the date in the footer.

If presentation are all words or note form, you can choose to highlight the key point that you are presenting by making the key point which you have already present in dim color. In order to do this, you highlight your key point then click on the custom animation, then click on the effect that you have set before, then a window will pop up. In the window you can choose the color of the word that it should appear after the animation. This can help to present more effectively by highlighting your key point.

Then you can also add animation to your slide which can make your presentation more interesting. By adding animation, the things that you want to present can pop up in many ways which is like animation. Then if your want to link one slide to another slide, for example from slide 1 to slide 4, you can use ‘hyperlink’. This ‘hyperlink’ not only can link within slide, but you also can link from the slide to other format file or website which is useful and can make your presentation more effective.

After creating all your Power Point, you can either save your presentation in pps. format or ppt. format. pps. format stand for power point show which if you save in this form, when you open your power point, it will directly open your presentation. If in ppt. format, when you open your power point, it will use the Microsoft Power Point to open.

Research...(part 2)

After come out with a topic for our research and the objective of the research, we start to find some information about the topic.Then we start to create and figure out the question for our questionnaire of the research. Then, we print out the questionnaire.

We distribute the questionnaire to 60 students which consist of Degree second year and Diploma second year of nursing students. We give them some time to do and collect back from them on that day or on the next day.

Wednesday, April 1, 2009

Research...

One more assignment from the IT class...RESEARCH...we were asked to form into a small group which consist of 3 members and do a research which related to nursing and IT. The participants of the research is at least 60 persons. We were asked to come out with a question before the class end. So, after discuss and discuss, our group decide to do a research on the effectiveness of the ICT course towards nursing students and the application of it by nursing student.

We come out with this idea is because a lot of people feel weird and wonder why a nursing student need to attend a IT class. A nurse only need to deal with a patient but not a computer. This is the opinion of most people. Some student might think that it is a waste of time to attend the IT class because some knowledge that teach in the IT class they already knew it before. So in this research, we are going to find out the use and purpose of this IT course and the effective of this IT toward nursing student. We wish to prove that the IT course is a necessary subject for a nursing students. A nurse need to be up to date.

So, after deciding the topic, we start to discuss and write out the purpose of the research and the introduction of the research. We also start to create the question for the research. But not the complete question. It just a draft of the question.

Tuesday, March 31, 2009

Ways to create a program book by using Word...

This time in the IT class, we need to create a program book which the book. Three persons in one group. We can create a program book by using Microsoft Word. The program book that we plan to create which is half of A4 size which mean we are going to fold the A4 paper into half. If you think that it is difficult to decide which page should come first or found difficulty when printing, there is a setting in Microsoft Word can help you solve all this problems.

First, click on ‘File’ which you can find this on the left upper part. Then, click on ‘Page Setup’. In the Page Setup, in the column of multiple pages, change ‘Normal’ into ‘Book Fold’.

After choosing it, the orientation of the page will automatically change into landscape. You can also set your margin to be narrower so that you can fit more things in your book fold. After all the setting, remember to click ‘ok’ to complete your setting. Then, you can start to create your program book and insert text. The program for my program book is a “Program Khidmat Bakti” which is a visiting to a village and give community services to the people in the village. We did create a front cover for our program book. Besides, the content of our program book include speech from the vice chancellor, speech from the head of the department, speech from the president of the program, introduction and objective of the program, the schedule of the program, the organization of the committee members and many more.

Friday, March 13, 2009

Ways to create a brochure...

This time, we were asked to create a brochure. How to create it? It is simple and easy to create a brochure. You can use Microsoft Word to create a brochure. Your brochure is basically just two landscape oriented pages set up with three columns. But before starting to create a brochure, you should try to create a brochure using a paper. By using a paper, you will have a brief idea about how your brochure will look like and how you should you fold your brochure. After deciding how your brochure going to look like, you an start to create it using Word.

1. Figure your layout

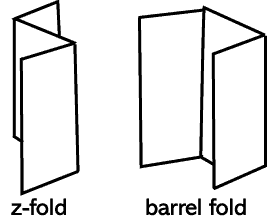
Before you open Word, you should figure out how the panels of your brochure will appear on the paper. There are two types of folds commonly used in brochures: the z (or accordion) fold and the barrel (or roll) fold. As the name indicates, with a z-fold, the paper is folded in alternating directions, which is good if you want to present information sequentially. The barrel fold is much like you'd fold a letter before putting it in an envelope (the second fold wraps around the first one).

This time i choose to create my brochure in the form of barrel fold. Then you have to decide which is fold is your first page.


2. Set up your paper

You should change your page orientation to landscape. Then you can set up the margins of the paper which you think is suitable for your brochure. Then after all the setting, you can click 'OK'.Next, in the page setup, click on the 'Paper' on the column above. This time, you are going to set up your paper size. There various size of paper that your can choose. But, i decided to choose A4 size paper which I think is not too big and not too small.

3. Set up columns

In order to let the brochure can fold into 3 parts, you have to set up the column into 3. Which mean that when you type your information in the paper, it will automatically start from the first column and continue to the second and third. This allow you to fold the paper into a brochure after you print it out.

4. Add and format text

Your layout is now all set up. You should see two pages that each have three panels with a blank paragraph in each one. Now you can begin adding text. Column break. When you are adding text, don't forget about where it will end up in the finished product. The cover may actually be the last panel (refer to your folded scrap piece of paper if you forget). Don't forget to create and design your cover of your brochure. You can format the text as you type or type it all in first and format later.

5. Add picture

The whole goal of any brochure is to communicate. Anything that is hard to read, won't be read. So in order to make your brochure to become interesting and easy to understand, you can add some pictures that are related in your brochure which can make your brochure colourful and attract others to read your brochure. It is important to make your brochure attractive in order to reach the goal of dissemination information to other. Brochure is a good and easy media to disseminate useful and important information.

6. Print it out

After you have done all the things, you can print your brochure out. But remember, must print it by using one paper only and both pages of that paper.